GPS tracking in Prilep, Bitola, Ohrid, Kicevo, and Tetovo
GPS tracking in Prilep, Bitola, Ohrid, Kicevo, and Tetovo
Following stray dog population counting, the ground research team, led by the Veterinary Specialist, began tagging a random sample of stray dogs with GPS devices. This allowed the project to draw insights regarding movement of dogs, their activity levels, as well as deviation from their “territory.” Most trackers were placed on dogs during early morning hours (usually between 5:00 and 10:00); exceptions occurred in which tags were placed later in the day, either due to dogs running away, or severe weather (heavy rain). In four of six communities, the team successfully placed tags on at least 10 dogs; in Gostivar, despite two attempts, the stray dogs encountered were nervous or aggressive, and GPS tracking was not possible, while in Tetovo, similar problems led to a limited number of three dogs tracked.
Movements were tracked for between seven and twelve days (see table below). For the sake of consistency, visualizations were made to begin at 23:00 hours prior to the morning when tags were placed, and then end at 23:00 hours prior to the morning when tags were removed. During data cleaning, data points with unusual inactivity (due to device malfunction or interception by local residents) were removed from the set.
| Location | Number of tracked dogs | Tracking period |
|---|---|---|
| Prilep | 13 | 7-13 July |
| Bitola | 10 | 10-17 August |
| Ohrid | 11 | 15-21 July |
| Kicevo | 14 | 24 July – 1 August |
| Tetovo | 3 | 20 August – 1 September |
Visualizations
Collected data has been visualized to show the following:
-
Movement of all dogs
-
Movement of male dogs
-
Movement of female dogs
-
Activity levels of all dogs
-
Deviation from “territory” of specific dogs
-
Detailed movement (live tracking) of a randomly chosen dog
GPS trackers operated mainly in a default tracking mode, in which location was reported every 2-60 minutes, with more frequent reporting as a dog’s activity level increased. Visualizations showing movement of dogs, their activity levels, as well as deviations from their “territory” all use data collected in default tracking mode. Alternately, a “live tracking mode” was activated manually at select times to provide location in near-real time at 2-3 second intervals; live tracking was used to provide detailed movement records for individual dogs.
Limitations
The visualizations below provide narrative insight rather than a representative quantitative dataset. One important limit to the data regards gender imbalance in the tracked population: although the team sought to tag equal numbers of male and female dogs, subsequent device malfunction and interception by local residents prevented a gender balanced sample in the analysis. A further limit to the dataset regards the inability to match locations and times with specific behaviors (especially feeding); however, locations and times (such as restaurant and commercial areas at meal service times, or multiple tagged dogs interacting in a location between the “territory” of each individual) allow us to make educated inferences about these as well.
“Movement” visualizations
The movement visualizations below (i.e., “Movement of all dogs,” “Movement of male dogs,” “Movement of female dogs”) provide a “big picture” view of home “territories,” movement patterns, and levels of activity throughout the day and night.

Movement of all dogs in Kicevo
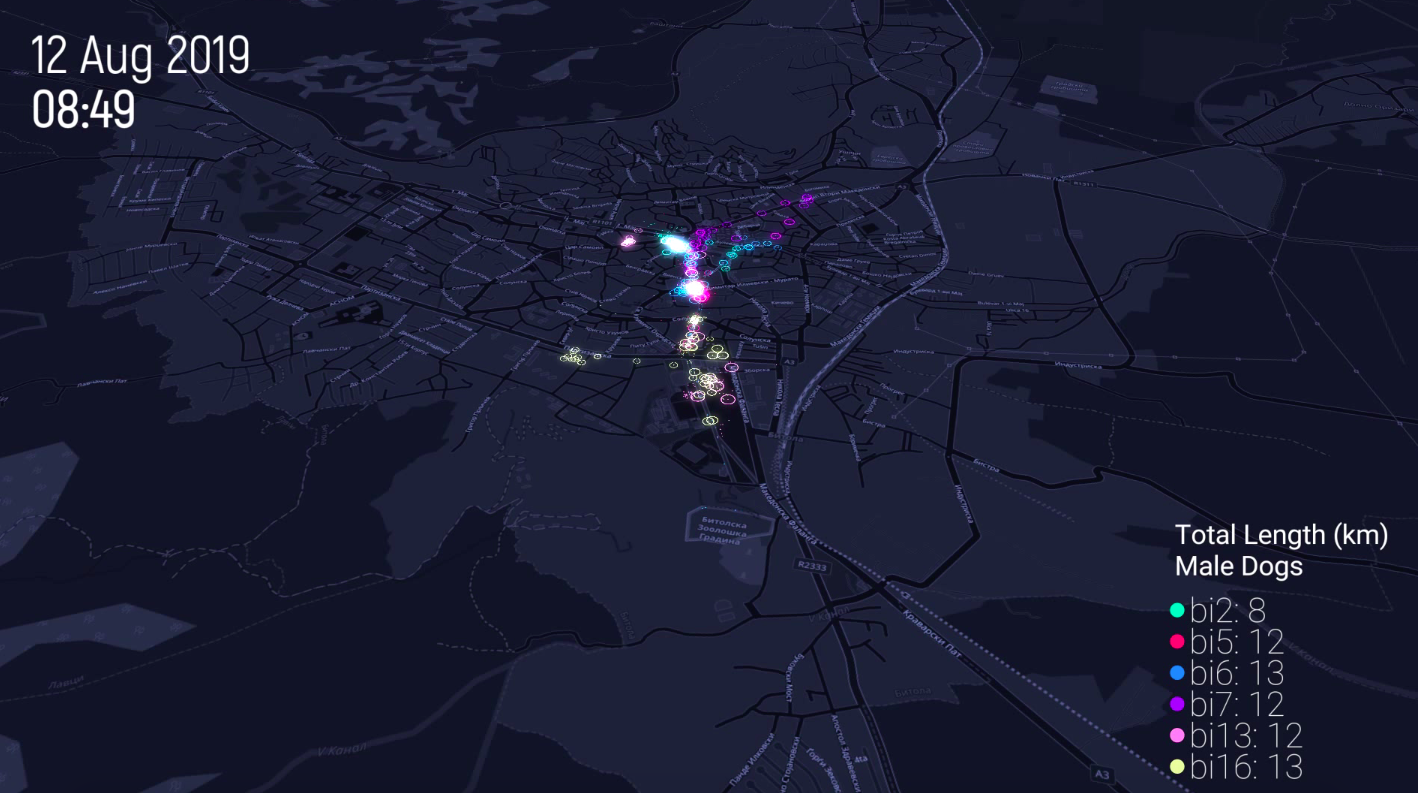
Movement of male dogs in Bitola
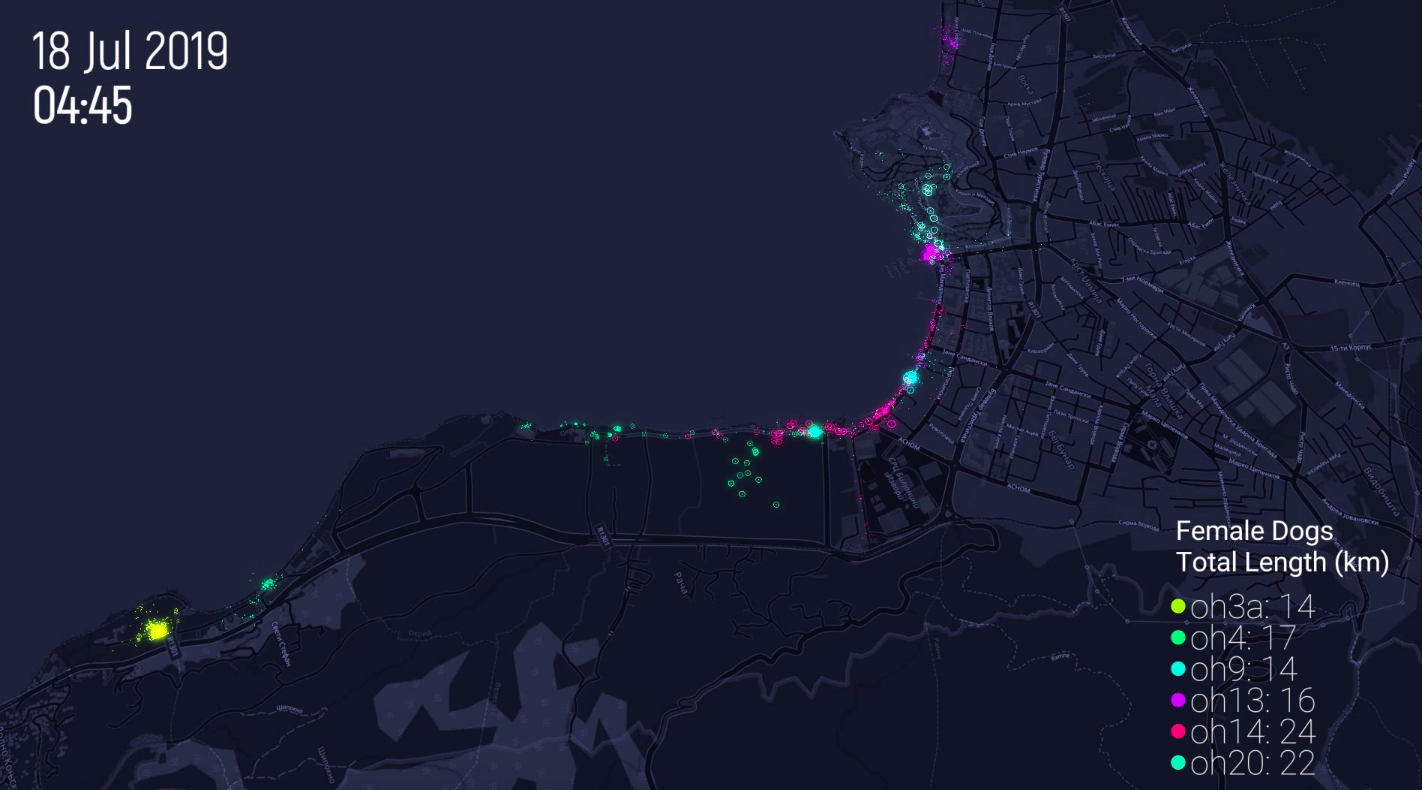
Movement of female dogs in Ohrid
“Activity Level” visualizations
The other two visualizations, namely “Dog activity levels” and “Deviation from territory” provide actionable insights that could eventually prove helpful for municipalities as they plan and carry out stray dog management programs and specific activities.
“Dog activity level” displays the aggregate positions of all tagged dogs from 0:00 to 24:00 across all days, in a single 24-hour animation. Results have been visualized on a 3D pillar heat map of activity, with a graph for total distance traveled. Two insights stand out from this graph which may prove useful to local municipal authorities when planning and carrying out stray dog population management activities:
-
Time: The highest average levels of activity were registered between 3:00 to 5:00 a.m., meaning that all tagged dogs were most active at this time, throughout the area.
-
Place: However, the highest levels of activity by location were registered at specific locations between 15:00 and 18:00 p.m., implying that these specific locations form common areas of congregation for multiple dogs at these times. This may prove useful for anticipating where and when to encounter dogs in groups.
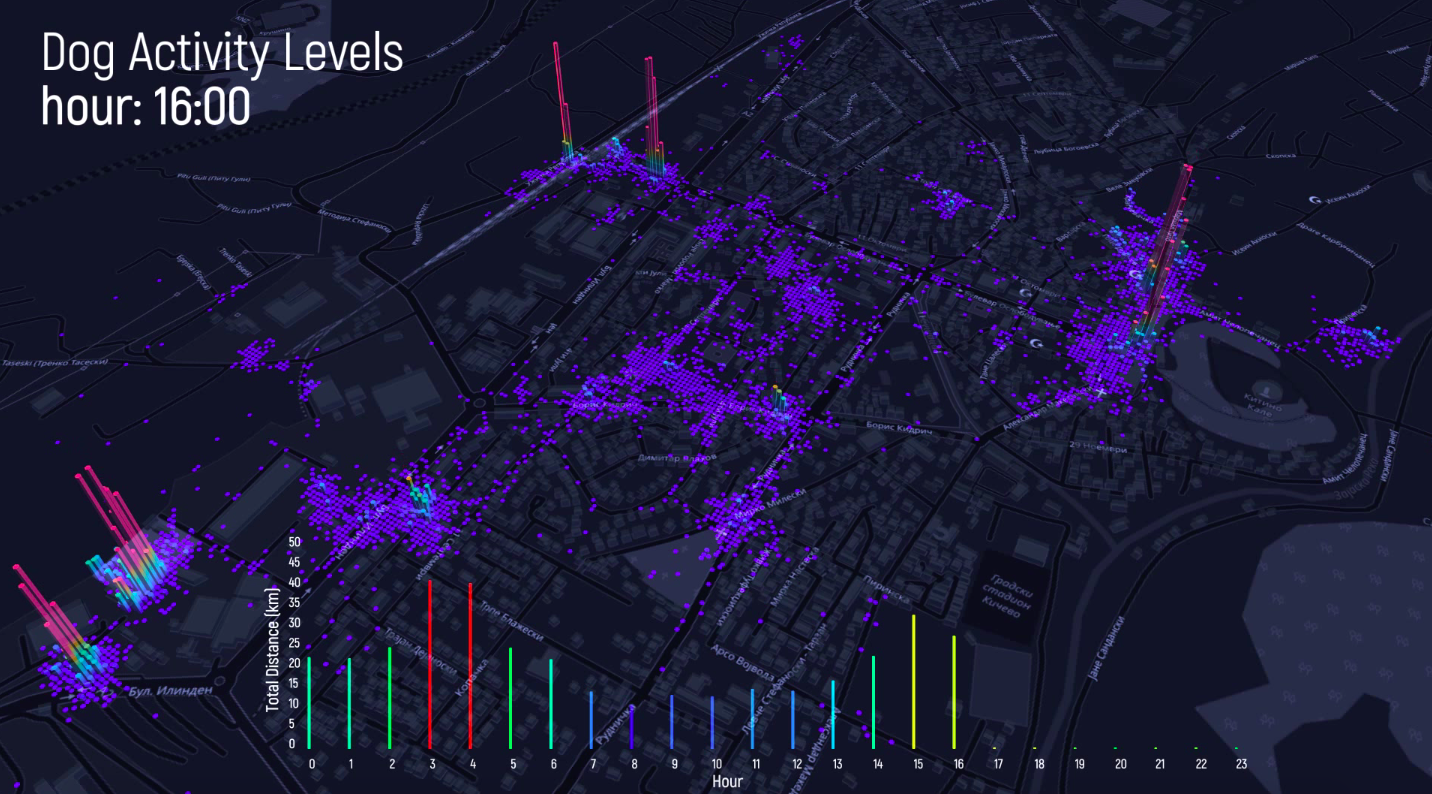
Dog activity levels in Kicevo
“Deviation” visualizations
Most animals, including dogs, tend to live in a general geographical area which is often known as “home range.” Home range can be a city, a specific city zone, or a large neighborhood. Territory, on the other hand, is usually a smaller area within the home range which contains resources such as food, water, and shelter. Generally speaking, animals, including dogs, occupy and defend these territories simply because it gives them a biological survival advantage. While “territoriality” is a known and generally accepted concept in stray dog population management models, our team wanted to confirm whether our data proved this to be the case. In order to determine a dog’s “territory,” each tagged dog’s movements were mapped to show where they spent the largest portion of time (see example heat map below).

One dog’s territory in Kicevo
Using this determination of “home territory,” the team calculated deviation from this area as a single measurement of maximum distance in any direction. The resulting visualization shows deviation as a circle, with maximum distance as the radius, in order to visualize distance more easily. The visualization is accompanied by a chronological graph, detailing the distance in meters from home territory over time. The lower right corner of the visualization shows the maximum deviation distance recorded during the tracking period, which corresponds do the highest spike in the horizontal metric graph.
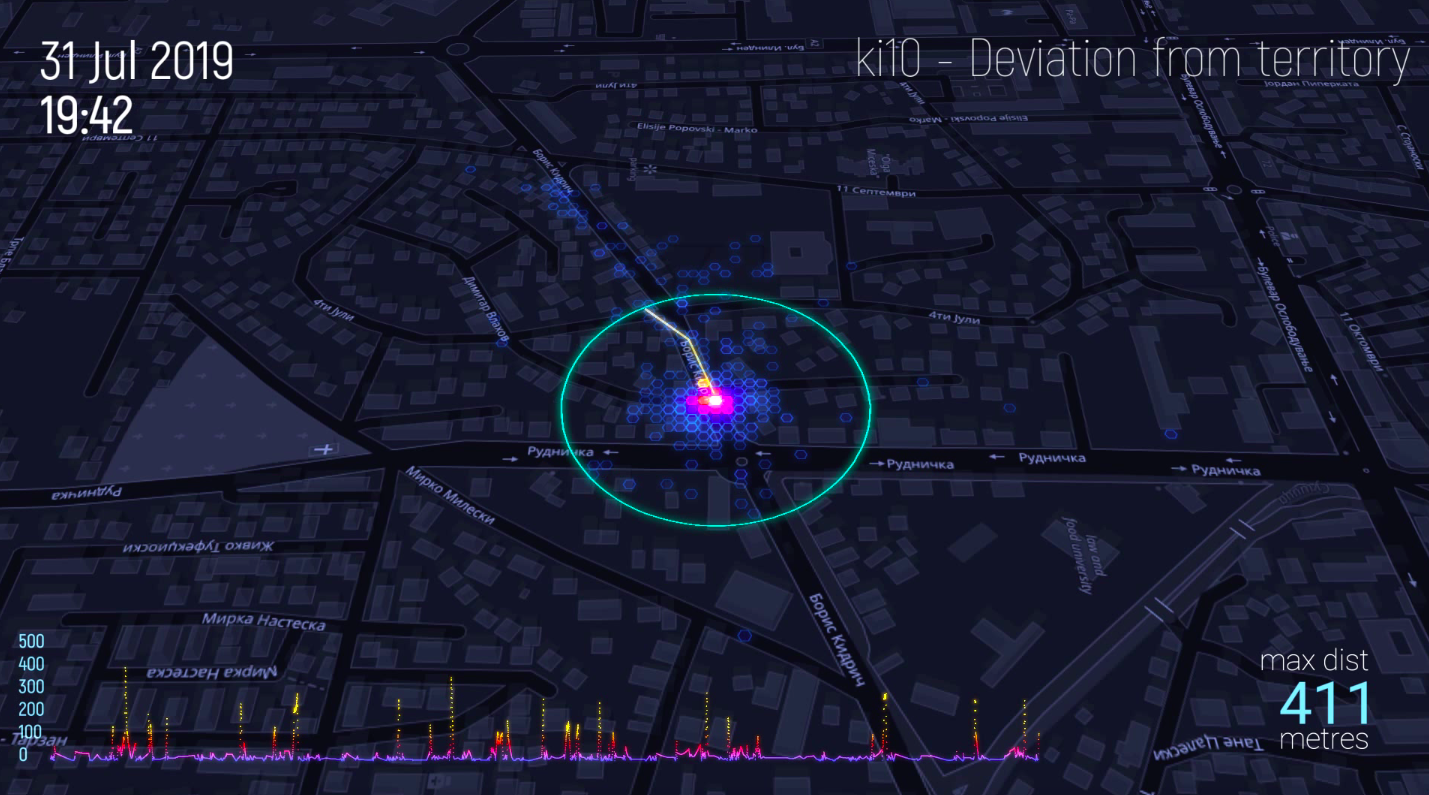
Deviation from territory of a dog in Kicevo
The finding that stray dogs roam within a home range, but tend to spend most of their time in a specific territory, is an especially important one for local authorities undertaking CNVR activities. For a successful reduction of stray dog population through CNVR, it is crucial that treated (vaccinated and neutered) dogs are released back to the original place of capture, namely their “territory.” As long as this part of the CNVR process is fully respected by those in charge of CNVR, dogs themselves will do the rest of the job by fending off the potential untreated and fertile intruders trying gain access to their resources.
“Detail” visualizations
Finally, during the tracking period, a number of dogs were tracked using the live tracking mode, in which GPS devices reported its location every 2-3 seconds regardless of whether the dog was mobile or restive. This higher sampling rate allowed the team to visualize movement of gods via traces. During data cleaning, the team identified tracking intervals for which higher sampling rates were available and one dog per location was chosen randomly.
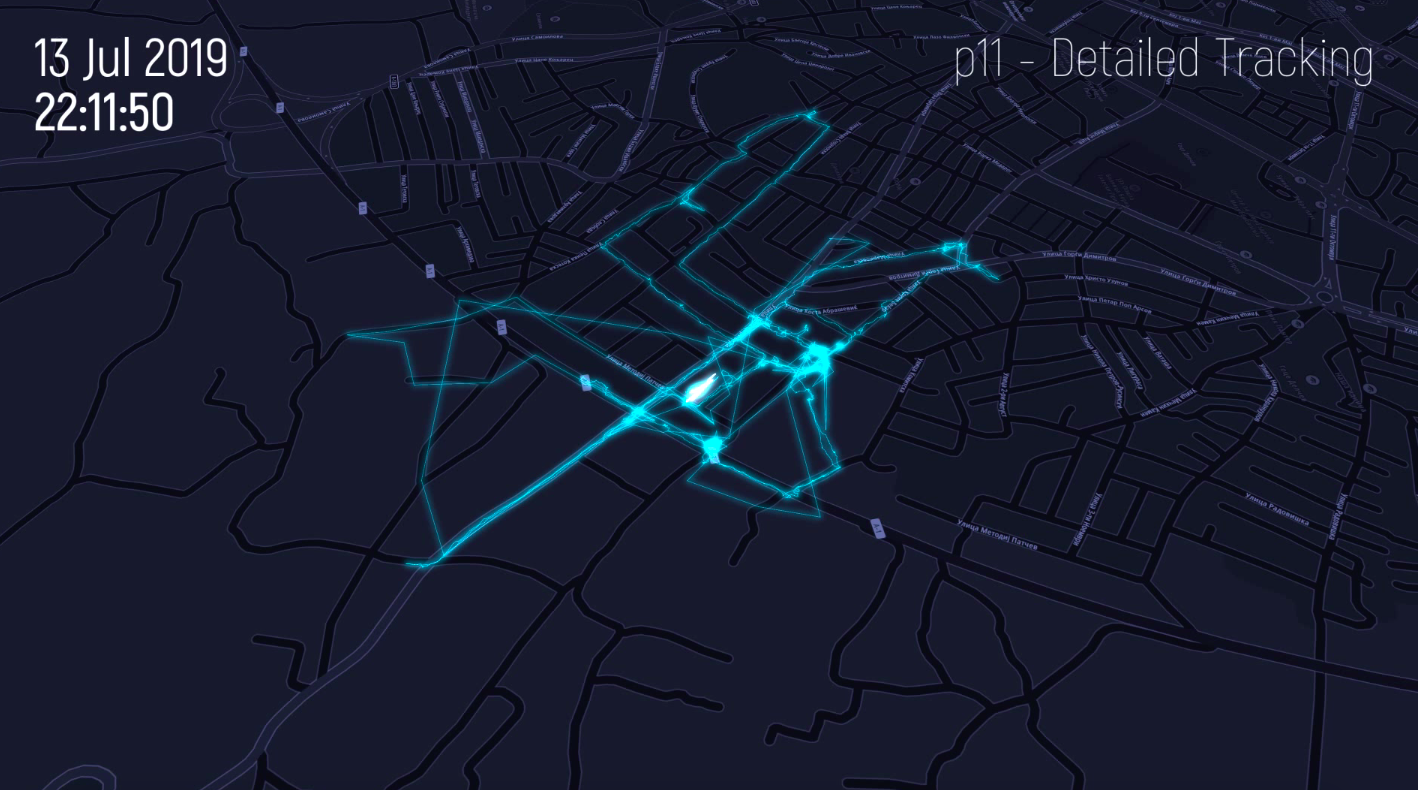
Detailed tracking of a dog in Prilep
Below are specific visualizations in each of the locations:
Prilep
1. Movement of all dogs
2. Movement of male dogs
3. Movement of female dogs
4. Activity levels of all dogs
5. Deviation from “territory” of specific dogs
6. Detailed movement (live tracking) of a randomly chosen dog
Bitola
1. Movement of all dogs
2. Movement of male dogs
3. Movement of female dogs
4. Activity levels of all dogs
5. Deviation from “territory” of specific dogs
6. Detailed movement (live tracking) of a randomly chosen dog
Ohrid
1. Movement of all dogs
2. Movement of male dogs
3. Movement of female dogs
4. Activity levels of all dogs
5. Deviation from “territory” of specific dogs
6. Detailed movement (live tracking) of a randomly chosen dog
Kicevo
-
Movement of all dogs
2. Movement of male dogs
3. Movement of female dogs
4. Activity levels of all dogs
5. Deviation from “territory” of specific dogs
6. Detailed movement (live tracking) of a randomly chosen dog
Tetovo
-
Movement of all dogs
2. Activity levels of all dogs
3. Deviation from “territory” of specific dogs
4. Detailed movement (live tracking) of a randomly chosen dog